
When you work with Excel every day, you quickly realize one thing — scrolling through thousands of rows is not analysis. It is just manual effort. Over the last 10+ years of creating Excel dashboards, MIS reports, and automation systems for clients, I have seen how the Excel filter formula can completely transform productivity.
Many professionals rely only on the basic filter button. However, once you start using formula-based filtering, your reports become dynamic, cleaner, and far more powerful. Moreover, it reduces dependency on manual sorting and repetitive tasks.
If you handle sales data, HR records, finance sheets, or performance reports, understanding filter formulas is not just helpful — it is essential.
Table of Contents
ToggleQuick Summary
The Excel FILTER function allows you to extract specific rows from a dataset based on conditions. Unlike AutoFilter, it creates dynamic results that update automatically when data changes. It is available in Excel 365 and Excel 2021+.
What Is an Excel Filter Formula and Why It Matters
Real-world understanding of filter formulas
An Excel filter formula extracts data from a large dataset based on specific conditions. Unlike the traditional filter tool, it does not hide rows. Instead, it generates a new dynamic output range.
In real business scenarios, this matters a lot. For example, while building a sales dashboard for a regional distributor, I needed live data filtered by city and monthly target. Manual filters failed because managers kept changing data. A filter formula solved the issue permanently.
Therefore, filter formulas are ideal when your data updates regularly.
Filter button vs filter formula: Practical comparison
The AutoFilter option is useful for quick checks. However, it is not reliable for reporting. Once someone clears the filter accidentally, your view changes.
On the other hand, filter formulas:
-
Update automatically
-
Work with multiple conditions
-
Can be connected to charts
-
Do not modify original data
This makes them better for structured reporting systems.
When professionals prefer filter formulas
In my experience, filter formulas are most useful when:
-
Preparing monthly MIS reports
-
Creating dynamic dashboards
-
Automating recurring analysis
-
Sharing Excel files across teams
Moreover, they reduce errors that happen due to manual filtering.
Using the FILTER Function in Excel (Dynamic Arrays)
Why the FILTER function changed Excel reporting
When Microsoft introduced the FILTER function in Excel 365, it simplified data extraction dramatically. Earlier, we had to combine INDEX, SMALL, and IF functions. That process was complex and difficult for beginners.
The modern syntax is simple:
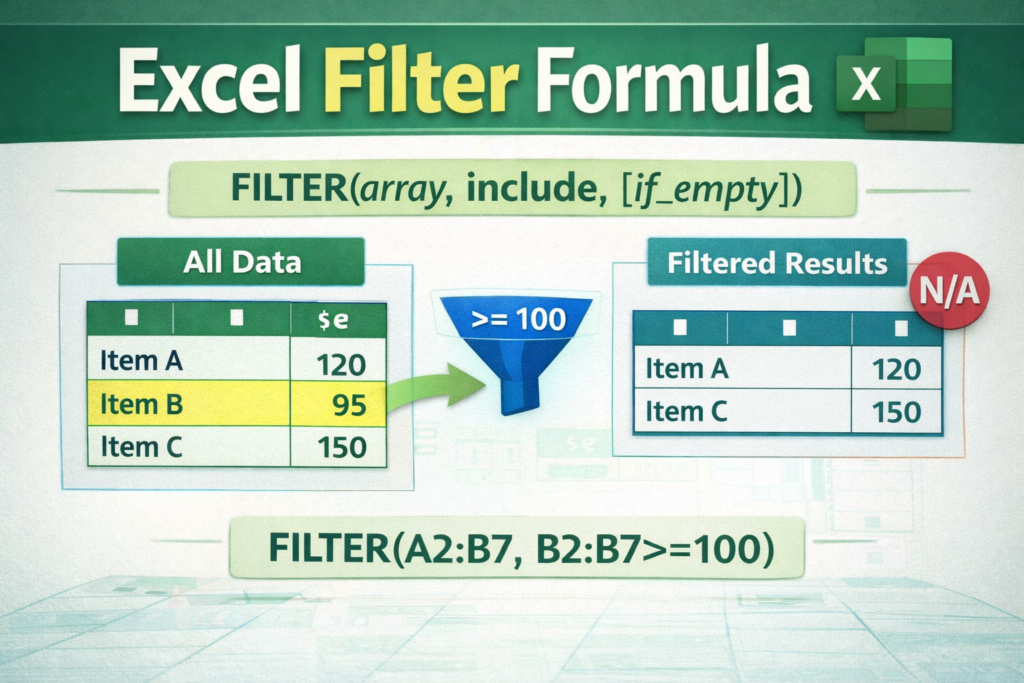
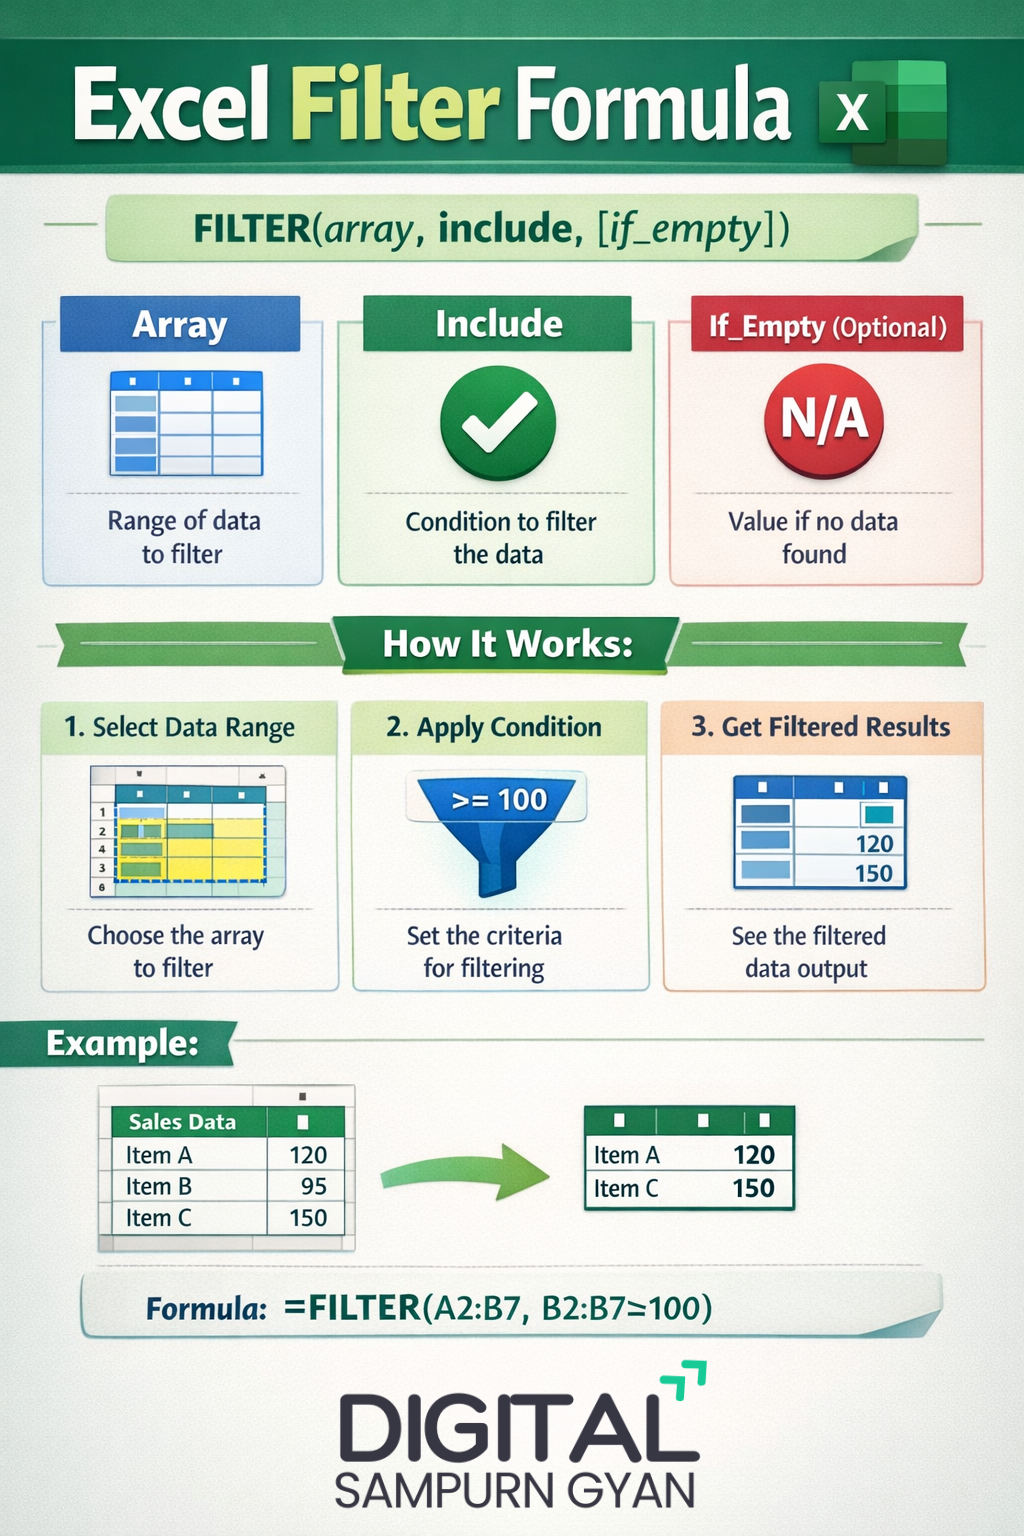
=FILTER(array, include, [if_empty])
Because of this, even non-technical users can now build powerful reports.
Practical business example
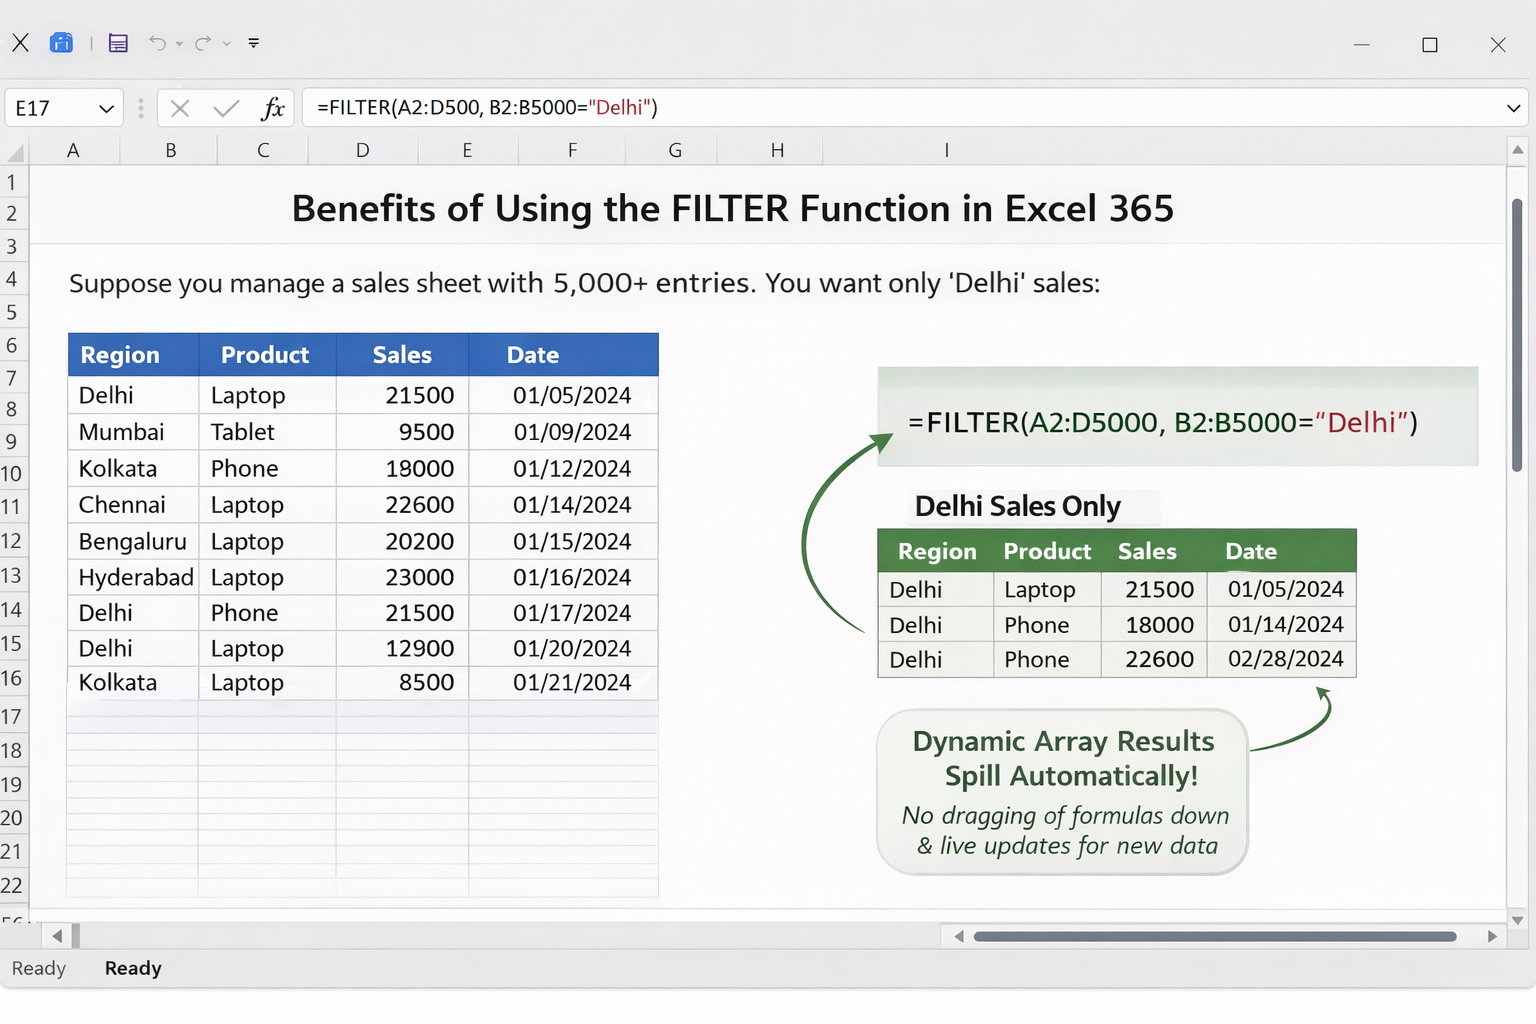
Suppose you manage a sales sheet with 5,000 entries. Column B contains region names. You want only “Delhi” sales.
=FILTER(A2:D5000, B2:B5000="Delhi")
This formula instantly displays Delhi records. If new entries are added tomorrow, the result updates automatically. Therefore, your reporting remains accurate without manual intervention.
Why dynamic arrays improve efficiency
Dynamic arrays “spill” results automatically. You do not need to drag formulas down. This reduces mistakes and keeps files clean.
In addition, this feature is extremely helpful when building Excel dashboards that connect to Pivot Charts or summary tables.
Excel Filter Formula with Multiple Conditions
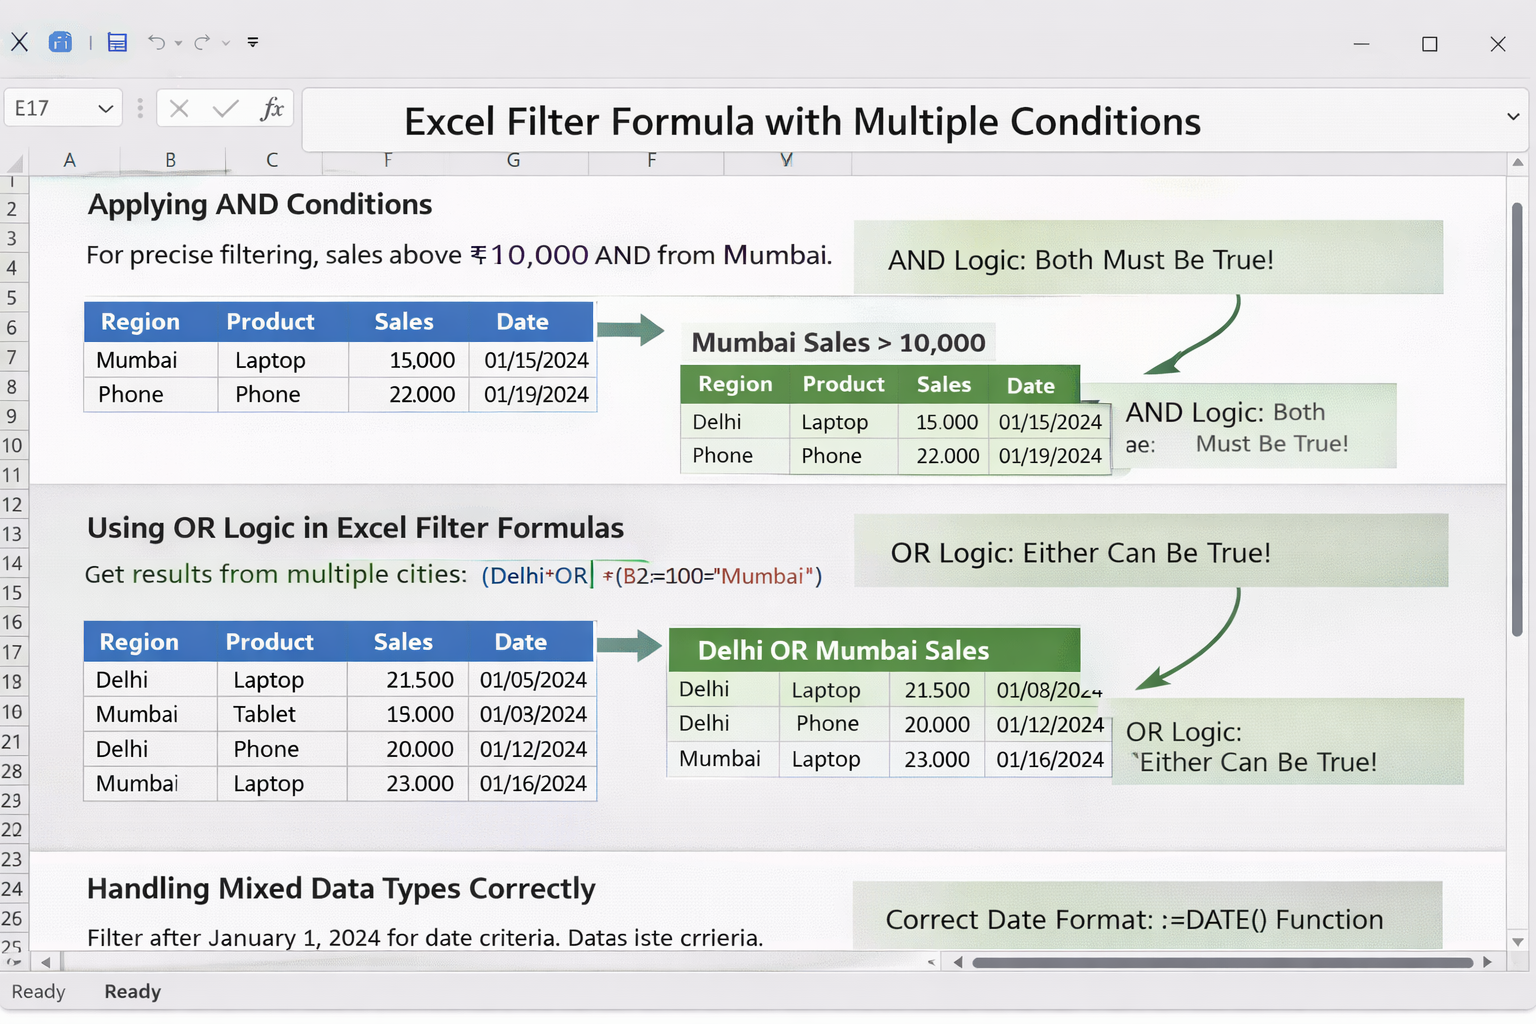
Applying AND conditions for precise filtering
Most real-life reports require more than one condition. For example, sales above ₹10,000 AND from Mumbai.
=FILTER(A2:D1000, (C2:C1000>10000)*(B2:B1000="Mumbai"))
The multiplication works as AND logic. Only rows meeting both conditions appear.
In practical reporting, this is useful for performance tracking and target analysis.
Using OR logic in Excel filter formulas
Sometimes, you want results from multiple cities.
=FILTER(A2:D1000, (B2:B1000="Delhi")+(B2:B1000="Mumbai"))
Addition acts as OR logic. Therefore, Excel shows data matching either condition.
This approach is commonly used in regional performance reviews.
Handling mixed data types professionally
One common mistake beginners make is ignoring data types. Dates, numbers, and text must be handled correctly.
For example:
=FILTER(A2:D1000, D2:D1000>=DATE(2024,1,1))
This filters records after January 1, 2024. In finance reporting, this technique is extremely useful during quarterly analysis.
Advanced Excel Filter Formula Techniques
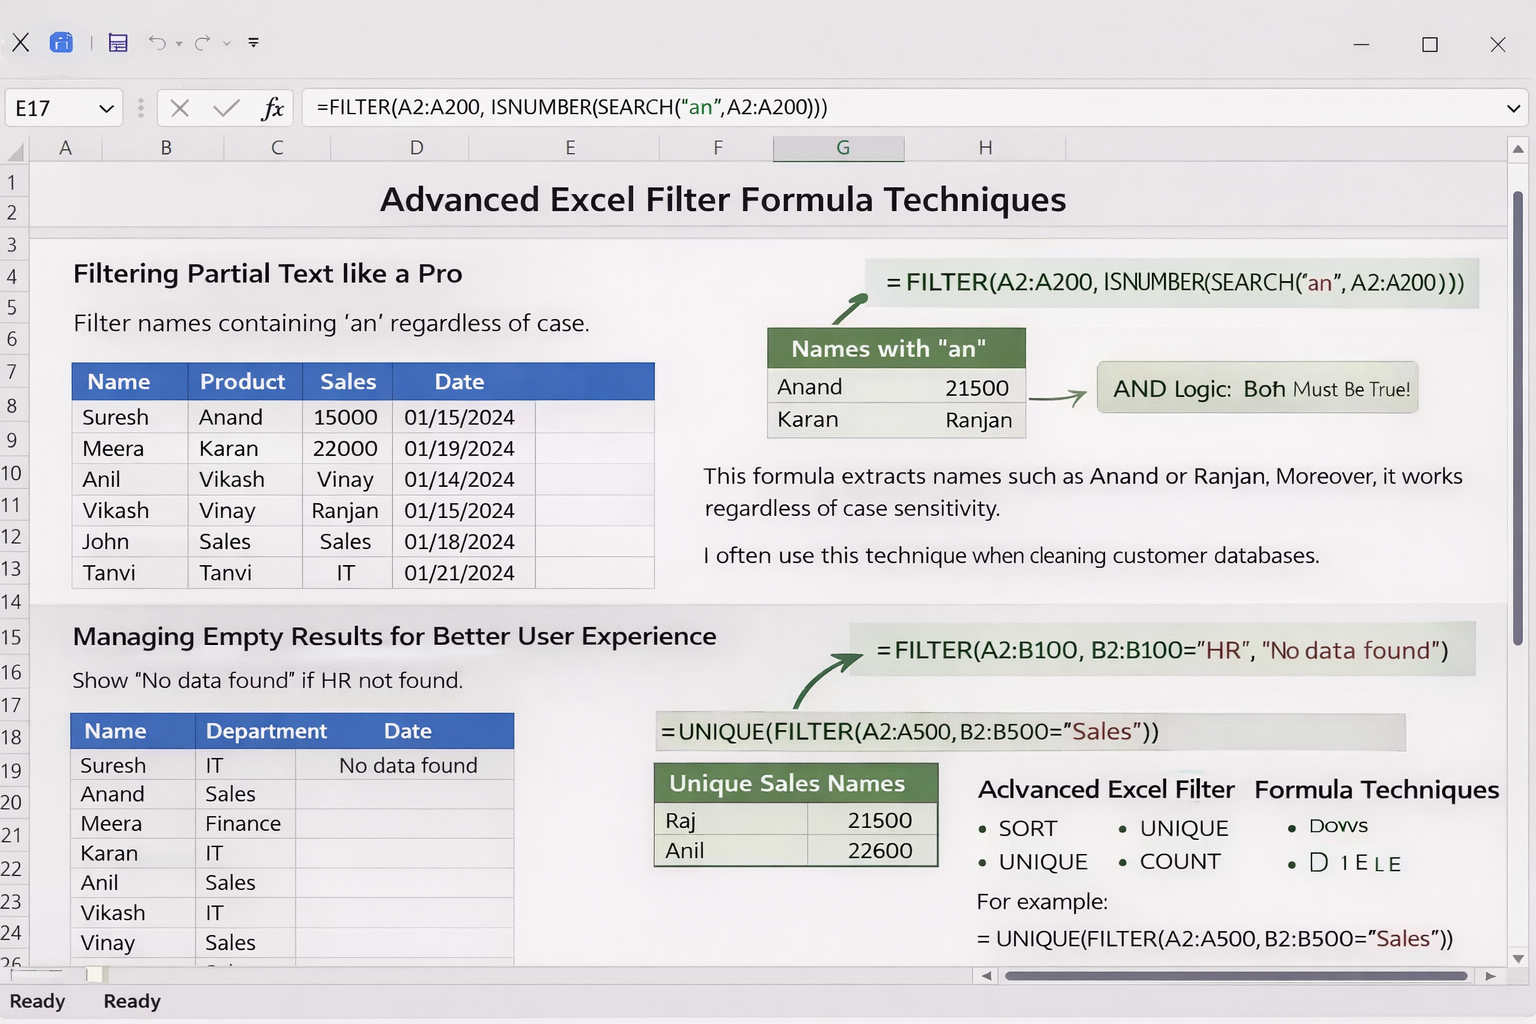
Filtering partial text like a pro
In large HR databases, you may need to filter names containing certain letters.
=FILTER(A2:A200, ISNUMBER(SEARCH("an", A2:A200)))
This formula extracts names such as Anand or Ranjan. Moreover, it works regardless of case sensitivity.
I often use this technique when cleaning customer databases.
Managing empty results for better user experience
A professional Excel file should never display errors.
=FILTER(A2:B100, B2:B100="HR", "No data found")
This ensures that if no records match, the message appears instead of an error. As a result, reports look polished and client-ready.
Combining FILTER with other Excel functions
Advanced users often combine FILTER with:
-
SORT
-
UNIQUE
-
COUNT
-
SUM
For example:
=UNIQUE(FILTER(A2:A500, B2:B500="Sales"))
This gives unique sales names. Such combinations are widely used in automation projects.
Real-Life Use Cases of Excel Filter Formula
Sales and performance dashboards
In one project for a retail chain, the management required daily region-wise reports. Instead of building multiple sheets, we used filter formulas connected to drop-down lists. Therefore, managers could select a city and instantly see filtered results.
This reduced report preparation time by more than half.
HR attendance and payroll analysis
HR teams frequently filter:
-
Late entries
-
Absent employees
-
Department-wise records
Filter formulas make these tasks automatic. Moreover, they help maintain clean payroll calculations.
Finance and accounting controls
Accountants often filter transactions by:
-
Date range
-
Amount range
-
Expense category
Using filter formulas ensures accuracy. As a result, audit preparation becomes easier and faster.
These examples show that Excel filter formulas are not just technical tools. They are business productivity tools.
Excel Filter Methods: Side-by-Side Comparison
| Feature / Criteria | AutoFilter (Filter Button) | FILTER Function (Dynamic Array) | Advanced FILTER with Conditions |
|---|---|---|---|
| Best For | Quick manual filtering | Dynamic reports | Automated dashboards & analysis |
| Updates Automatically | No (needs manual refresh) | Yes | Yes |
| Multiple Conditions | Limited | Yes | Yes (AND / OR logic) |
| Works with Formulas | No | Yes | Yes |
| Can Show Custom Message if Empty | No | Yes (if_empty) |
Yes |
| Supports Partial Text Filtering | No | Yes (with SEARCH) | Yes |
| Suitable for Dashboards | Not ideal | Good | Excellent |
| Handles Date Conditions | Basic | Yes | Yes (with DATE function) |
| Beginner Friendly | Very easy | Easy | Moderate |
| Excel Version Required | All versions | Excel 365 / 2021+ | Excel 365 / 2021+ |
AND vs OR Logic in Excel FILTER Formula
| Logic Type | Formula Structure | Meaning | Practical Use Case |
|---|---|---|---|
| AND Logic | (Condition1)*(Condition2) |
Both conditions must be TRUE | Sales above ₹10,000 AND from Mumbai |
| OR Logic | (Condition1)+(Condition2) |
Either condition can be TRUE | Sales from Delhi OR Mumbai |
| Date Condition | DateRange>=DATE(2024,1,1) |
Filters records after specific date | Quarterly financial reporting |
| Partial Text | ISNUMBER(SEARCH("an",Range)) |
Filters names containing text | HR or customer database cleaning |
Basic FILTER vs Combined FILTER Functions
| Scenario | Basic FILTER | FILTER + UNIQUE | FILTER + SORT | FILTER + SUM |
|---|---|---|---|---|
| Extract matching rows | Yes | Yes | Yes | Yes |
| Remove duplicates | No | Yes | No | No |
| Sort results automatically | No | No | Yes | No |
| Calculate totals | No | No | No | Yes |
| Used in automation projects | Limited | High | High | High |
Example:
-
Basic:
=FILTER(A2:D1000, B2:B1000="Delhi") -
Unique:
=UNIQUE(FILTER(A2:A500, B2:B500="Sales")) -
Date filter:
=FILTER(A2:D1000, D2:D1000>=DATE(2024,1,1))
Frequently Asked Questions (FAQs)
What is the most efficient way to use Excel filter formula for large datasets?
For large datasets, use structured tables and dynamic ranges. Avoid full column references if performance slows down. Moreover, ensure your data is clean and consistent to prevent calculation delays.
How do professionals use Excel filter formulas in dashboards?
Professionals connect filter formulas to drop-down lists using data validation. This allows users to select criteria dynamically, and the report updates automatically without manual filtering.
Can Excel filter formulas handle multiple criteria with dates and text together?
Yes, you can combine conditions using multiplication (AND) and addition (OR). For example, filter by city and date range simultaneously. This is common in financial and sales reporting.
Why is my FILTER function showing a spill error?
A spill error occurs when cells below the formula are not empty. Clear the blocked cells to allow dynamic array results to expand properly.
Is Excel filter formula better than Pivot Table?
Both serve different purposes. Pivot Tables summarize data, while filter formulas extract specific records. In many advanced dashboards, professionals use both together.
How can beginners practice Excel filter formulas effectively?
Start with small datasets. Practice filtering by one condition first. Then gradually add multiple conditions, date filters, and text searches to build confidence.
Final Thoughts
From years of hands-on Excel reporting and automation projects, one thing is clear — mastering the Excel filter formula is a career advantage. It saves time, reduces errors, and makes your reports dynamic and professional.
If you work in sales, HR, finance, or operations, learning advanced filtering techniques can significantly improve your workflow. Start simple, experiment with real datasets, and gradually combine functions for smarter results.
Excel is not just a spreadsheet tool. With the right formulas, it becomes a powerful data engine.